Thursday, June 10, 2010

Interesting Internet Movie Database statistics - in Python

In one of my previous posts I presented how to load the database files from IMDB in the Python shell.

In the same way not only the release year but other information can be loaded, like the language, genre, ratings, country, etc.

To plot graphics in Python you can use the matplotlib. To use this library you will need the numpy package too.

All the functions used to extract info's from the loaded database can be found at the end of the post.
You can download the full code to load the database and make the queries from: imdb.py and query.py

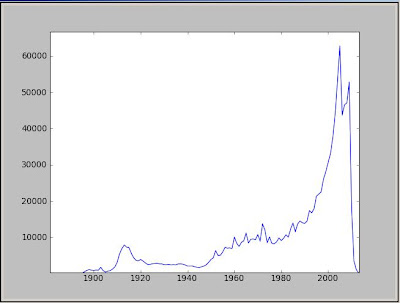
Lets obtain the number of movies by year:

> MbY = query.MoviesByYear(imdb.Movies)


To plot the resulting data:

> from pylab import plot,show,legend
> plot(MbY.keys(), MbY.values())
> show()


Now lets see the number of movies by countries:

> MC = query.ByCountry(imdb.Movies)
> MC[0:10]
[('USA', 328177),
('UK', 64717),
('France', 38066),
('Germany', 31408),
('Japan', 28819),
('Canada', 24745),
('Italy', 23877),
('India', 23687),
('Spain', 18313),
('Mexico', 17544)]


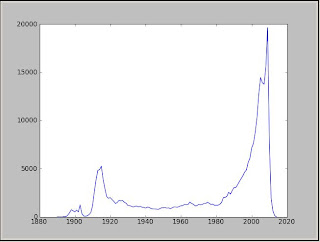
Plot the movie count for USA by year:

> USA = query.CountryByYear(imdb.Movies, 'USA')
> plot(USA .keys(), USA .values())
> show()


Now plot more countries on the same figure:

> UK = query.CountryByYear(imdb.Movies, 'UK')
> France = query.CountryByYear(imdb.Movies, 'France')
> Germany = query.CountryByYear(imdb.Movies, 'Germany')
> Japan = query.CountryByYear(imdb.Movies, 'Japan')
> Canada = query.CountryByYear(imdb.Movies, 'Canada')
> p1=plot(UK.keys(), UK.values())
> p2=plot(France.keys(), France.values())
> p3=plot(Germany.keys(), Germany.values())
> p4=plot(Japan.keys(), Japan.values())
> p5=plot(Canada.keys(), Canada.values())
> show()
> legend( (p1, p2, p3, p4, p5), ('UK', 'France', 'Germany', 'Japan', 'Canada'), 'upper left', shadow=True)
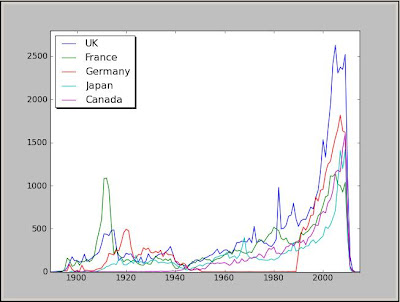


For Germany the movie count is 0 between 1950 and 1989 because the country was divided into East and West Germany.

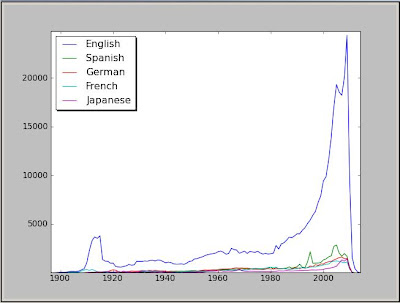
Now lets see the same plots for movie count by languages:

> BL = query.ByLanguage(imdb.Movies)
> BL[0:10]
[(u'English', 409215),
(u'Spanish', 50291),
(u'German', 43118),
(u'French', 35512),
(u'Japanese', 26340),
(u'Italian', 22422),
(u'Portuguese', 9902),
(u'Hindi', 8362),
(u'Dutch', 8161),
(u'Russian', 8131)]
> Eng = query.LangByYear(imdb.Movies, 'English')
> Sp = query.LangByYear(imdb.Movies, 'Spanish')
> Ger = query.LangByYear(imdb.Movies, 'German')
> Fr = query.LangByYear(imdb.Movies, 'French')
> Jp = query.LangByYear(imdb.Movies, 'Japanese')
> p1=plot(Eng.keys(), Eng.values())
> p2=plot(Sp.keys(), Sp.values())
> p3=plot(Ger.keys(), Ger.values())
> p4=plot(Fr.keys(), Fr.values())
> p5=plot(Jp.keys(), Jp.values())
> show()
> legend( (p1, p2, p3, p4, p5), ('English', 'Spanish', 'German', 'French', 'Japanese'), 'upper left', shadow=True)


Find bellow the simple functions used to extract information for statistics.


# Number of movies by year:
def MoviesByYear(i):
    data={}
    for k,v in i.iteritems():
        if v.has_key('year') and v['year'].isdigit():
            if data.has_key(int(v['year'])) :
                data[int(v['year'])] = data[int(v['year'])] + 1
            else:
                data[int(v['year'])] = 1


# Number of movies by year per country:
def CountryByYear(i,country):
    data={}
    for k,v in i.iteritems():
        if v.has_key('country') and v['country']==country:
            if v.has_key('year') and v['year'].isdigit():
                if data.has_key(int(v['year'])) :
                    data[int(v['year'])] = data[int(v['year'])] + 1
                else:
                    data[int(v['year'])] = 1
    return data


# Number of movies by language
def languagesort(x,y):
    if x[1]>y[1]:
        return -1
    if x[1]<y[1]:
        return 1
    if x[1]==y[1]:
        return 0
        
def ByLanguage(i):
    data={}
    for k,v in i.iteritems():
        if v.has_key('language') :
            if data.has_key(v['language']) :
                data[v['language']] = data[v['language']] + 1
            else:
                data[v['language']] = 1
                
    ll = map(lambda (k,v): (k,v),data.items())
    ll.sort(cmp = languagesort)
    return ll


# Number of movies by country
def ByCountry(i):
    data={}
    for k,v in i.iteritems():
        if v.has_key('country') :
            if data.has_key(v['country']) :
                data[v['country']] = data[v['country']] + 1
            else:
                data[v['country']] = 1
                
    ll = map(lambda (k,v): (k,v),data.items())
    ll.sort(cmp = languagesort)
    return ll


def LangByYear(i,lang):
    data={}
    for k,v in i.iteritems():
        if v.has_key('language') and v['language']==lang:
            if v.has_key('year') and v['year'].isdigit():
                if data.has_key(int(v['year'])) :
                    data[int(v['year'])] = data[int(v['year'])] + 1
                else:
                    data[int(v['year'])] = 1
    return data


Thursday, May 27, 2010

Inclinometer in Python, for Symbian phones with accelerometer

Another example of how easy and fast applications can be developed in Python.

An example of a simple inclinometer (tilt meter, tilt indicator, slope alert, slope gauge, gradient meter, gradiometer, level gauge, level meter, declinometer, and pitch & roll indicator).

But first you need to install Python for Symbian S60. This can be installed on phones with Symbian OS 3rd or 5th edition. Download PyS60 binaries and install the runtime and the shell (copy the .sis files to phone and launch to install or install with your phones software).
The setup for Windows OS is for creation of installable packages from your Python application.

The code is the following:

from sensor import *
import e32
from appuifw import *
from random import randint

print "Accelorometer by Lazar Laszlo (c) 2009"

# Define exit function
def quit():
    App_lock.signal()
app.exit_key_handler = quit
 
app.screen = 'large' # Screen size set to 'large'
c = Canvas()
app.body = c
s1,s2=app.layout(EScreen)
mx = s1[0]
my = s1[1]
m2x = mx/2
m2y = my/2
sleep = e32.ao_sleep

# Function which draws circle with given radius at given co-ordinate
def circle(x,y,radius=5, outline=0, fill=0xffff00, width=1):
  c.ellipse((x-radius, y-radius, x+radius, y+radius), outline, fill, width)
 

class Inclinometer():
    def __init__(self):
        self.accelerometer = \
            AccelerometerXYZAxisData(data_filter=LowPassFilter())
        self.accelerometer.set_callback(data_callback=self.sensor_callback)
        self.counter = 0

    def sensor_callback(self):
        # reset inactivity watchdog at every 20th read
        if self.counter % 20 == 0:
            e32.reset_inactivity()

        # redraw at every 5th read
        if self.counter % 5 == 0:
            c.clear()
            circle(m2x+self.accelerometer.x*2, 160-self.accelerometer.y*2, 7, fill=0x0000ff)
            if self.accelerometer.z > 0:
                c.rectangle((0,m2y,15,m2y+self.accelerometer.z*2),fill=0x00ff00)
            if self.accelerometer.z < 0:
                c.rectangle((0,m2y+self.accelerometer.z*2,15,m2y),fill=0x00ff00)
            c.line((0,m2y,mx,m2y),outline=0,width=1)
            c.line((m2x,0,m2x,my),outline=0,width=1)
        self.counter = self.counter + 1

    def run(self):
        self.accelerometer.start_listening()

if __name__ == '__main__':
    d = Inclinometer()
    d.run()
    App_lock = e32.Ao_lock()
    App_lock.wait()  # Wait for exit event
    d.accelerometer.stop_listening()
    print "Exiting Accelorometer"


The appuifw module contains the functions and objects for the graphical user interface. You can set the applications window size with the app.screen variable. To use the whole screen as a drawing canvas set app.screen = 'large' and set the application body to the Canvas object.

The application gets the accelerometer data through a callback. In order to do not redraw the screen at every read, a simple counter is used. I doubled the accelerometers values to increase the circles movement. The x and y values are displayed as a circle centered to the screens center. The z value is displayed as a green bar.

I reset the phones inactivity watchdog with the e32.reset_inactivity() function to keep the back-light on while the application is running.

If your phone has a magnetometer (compass) you can switch the sensor from AccelerometerXYZAxisData to MagnetometerXYZAxisData and the self.accelerometer variables to self.magnetometer to display the direction to North.

To run the application just save the code to a text file with .py extension, copy the file to the phones \DATA\PYTHON directory (or into the \PYTHON directory in the phone memory).

Screen shots from my Nokia E52:


Feel free to use and play with this small code.

Monday, May 24, 2010

Python, episode 2.

Now back to Python.

Here is a nice cheat sheet about some basic language features, commands, variables.

In my first post about Python I presented the IPython shell add-on. It's very useful if you are doing some programming directly in the Python shell. You don't need to know all the functions from imported modules or objects, you can use the tab completion to quickly display all available members of an object or a module.
Example to find out the version of your Python, first import the "sys" module with:

import sys

Then type "sys." and then press the TAB button, now you will get a list of all available functions and member variables imported from the "sys" module. If you type "v" and press again TAB, you will get two options: sys.version and sys.version_info. The first option is already typed in the command line so you can press Enter to get the version information.
In Python everything is an object, every variable will have some member functions, for example a string:
mystring = 'My string'
Now if you type mystring.[TAB] you will get an impressive list of string processing functions.

A simple example to show the power of Python is a text processing program.
IMDB (The Internet Movie Database) has a big database of movies and related information. You can download the database as text files, which are not really easy to process. There is a text file for each movie related type of information. To do some statistics and complex queries I had to load the data into the memory, in a search-able way.

Here is the program:

import os
import string
import time
import sys

try:
    if len(Movies) == 0:
        Movies = {}
except:
    Movies = {}

def LoadMovies():
    global Movies
    filesize = os.path.getsize('movies.list')
    f=open('movies.list','rt')
    progress = [x * filesize / 100 for x in range(10,110,10)]
    start = False
    count = 0
    progressPos = 0
    lineNr = 0
    startTime = time.clock()
    print "0% ",
    for line in f:
        if lineNr%100 == 0 and f.tell() > progress[progressPos]:
            print str((progressPos + 1) * 10)+"% ",
            sys.stdout.flush()
            progressPos = progressPos + 1
        if start:
            ls = line.split('\t')
            if len(ls) > 1:
                moviename = unicode(string.strip(ls[0]),'latin_1')
                movieyear = string.strip(ls[-1])
                Movies[moviename]={'year':movieyear, 'genre':[]}
                count = count + 1
                if count == -1:
                    return
        else:
            if line.find('MOVIES LIST'):
                start = True
        lineNr = lineNr + 1
    print "100%\nLoaded",count,"entries."
    print "Done in ",time.clock() - startTime,"seconds."

Now a quick description:
The file is opened for reading with the open command. The "movies.list" file contains movie titles and release years.
First I read the file size to display the progress while reading the file. Almost 20% of the code above is this progress indicator, because I had to optimize for speed. In order not to read the position and calculate the percentage every time, I have pre-calculated for every 10th percent the position in the file. Then for every 100th line I get the position in the file and compare with the "progressPos"th value in the table. The line where I calculated these values may look strange, but this is called in Python "list comprehension". This is an expression followed by a "for" clause and then other "for" and "if" clauses.

Example: [2**x for x in range(0,8)] will calculate the power of two from 0 to 8 and the result will be [1, 2, 4, 8, 16, 32, 64, 128].

The "for" clause can be used for file reading too.
Because the text files from IMDB contain some other texts and details I had to jump over the lines until the actual list begins, for which I used the start variable.
Then I split every line by TAB character and I get the last word with the -1 position, because between the movie title and the movie year can be more TABs. This is another nice feature of the Python list indexing. In other languages you had to use the size-1 to get the last position, here you can use negative indexes.
I'm storing the title and year in a dictionary variable "Movies". Dictionaries are sometimes found in other languages as "associative memories" or "associative arrays". The C++ implementation is the "map" and HashTable in C#. The key will be the movie title and in the value another dictionary with key "year" and value the release year. This is because I will store later other information too.

Now, if you put this little program in a text file called imdb.py and save it in the same directory where you downloaded and unpacked the movies.list file, you can run the program either directly executing the ".py" file if you registered this extension to python. Or you can start IPython then change the current directory to the one where the files reside with the "cd" command. An example session you will find below:


Now sample queries:
- get all the movies for year 2010: y2010 = [k for k,v in imdb.Movies.iteritems() if v['year']=='2010']
- the number of movies: len y2010
- the first and last movie: y2010[0], y2010[-1]


To search by movie title, example for movies with "Star Trek" in title:
star_trek = [k for k,v in imdb.Movies.iteritems() if k.find('Star Trek') > 0]


You will need at least 1G RAM because the movie database contains 1.6 million items.

In the next post I will present the "MatPlot" library for Python and will make some nice graphics about movies by year, country, language, etc.

To be continued ...

Tuesday, May 18, 2010

Cheat sheets

Not the ones used by students without the instructor's knowledge to cheat on a test.

These are simple pages to help you in your work by providing quick references for programming languages, tools, web technologies, command line options etc.

You can print them but to be environment friendly just save them locally or open directly from the web.


Or use an iPad :


Now the links:
www.cheat-sheets.org/
www.addedbytes.com/cheat-sheets/
packetlife.net/library/cheat-sheets/

Monday, May 17, 2010

PYTHON


The Pythonidae, commonly known simply as pythons, from the Greek word python-πυθων, are a family of non-venomous snakes found in Africa, Asia and Australia. Among its members are some of the largest snakes in the world. Eight genera and 26 species are currently recognized. (long live Wikipedia)


Nice ...

Well this is not about that beautiful snake. It's about the Python programing language my new passion. Beside other languages I currently use at work or at home I'm starting to love this simple yet powerful interpreted language.

You can find it here together with more information.

What I like about it is the portability (there are implementations for Windows, Linux/Unix, Mac OS X, Symbian[mobile phones]) and the speed to develop small applications. No need for big development environments, for compiling etc. Just RUN.

If you are lazy to write it into a text file you can just type it into the command interpreter. That's about the bold interpreted word above.

I don't want to write about the language itself - you can find nice tutorials and Hello World apps on the net. I want to write about some modules I found useful.

The easiest way to install modules is using the setuptools utility. You should download the binary package for Windows or the sources for Linux if the distribution doesn't have it already.
Then you will have the easy_install.exe program in the Pythonxy\Scripts directory.

First, to enhance productivity, there is the IPython interactive computing environment.

To install: First easy_install pyreadline then easy_install ipython

Or you can get the binary distribution from the Download page, but you will need the pyreadline module too. This nice package will give you some help in the command line interface, like tab completion (linux/unix like), history, colors, etc.


to be continued ...

HTML5 - presentations, demos


The future of WEB or the WEB of the future, hard to decide.

A nice presentation of the new html standards capability.
To view the presentation a HTML5 capable web browser is needed, like: Mozilla Firefox, Google Chrome, Opera, Safari

Some nice applications of the HTML5/canvas element by Ben Joffe

Applications, games, tools and tutorials for the HTML5 canvas element

Test your browsers HTML5 support

The HTML5 standard